
Este estudo ainda não está disponível em português; ele é apresentado em inglês.
DAIS Insights · Paper 02
Paying for the Regulator
How any regulator can price its licences from the cost of the work behind them, recover that cost over the sector’s growth cycle and pass the tests applied by finance ministries, using a national waste regulator as a worked case.
- 10×The effort gap between the simplest and most complex licence, which a flat fee would hide
- 5 yearsThe horizon over which cumulative fee revenue should equal cumulative cost
- Under 4%Fees plus compliance costs as a share of small operators’ operating surplus, in every forecast year
In this paper
- 1Why cost-recovery fees matter
- 2The method: activity-based costing in seven steps
- 3Benchmarks: a range check, not a price list
- 4The tests a fee must pass before approval
- 5Governance: who approves, who keeps the money, when to review
- 6Ten mistakes that undermine a fee study
- 7Adapting the method to other countries and sectors
- 8What to do: a checklist for regulators
At a glance
- The signal
- A licence fee is not a price; it is the cost of the regulator’s work, shared fairly. When the fee is built step by step from that work and balanced over the five years a sector takes to mature, the regulator can fund itself without taxing the operators it is trying to bring into the formal system.
- Why it matters
- New laws make licensing compulsory faster than budgets can fund the regulators that issue the licences. A fee set too low leaves inspection unfunded, a fee set too high pushes small operators back into the informal sector, and a fee that cannot be explained is challenged. Waste is the worked case here, but the same methodology applies to environmental, water, energy, health and transport regulators.
- What we found
Cost the work, not the institution: every fee is traced to six process steps, each weighted by the effort a licence type requires.
Effort sets the price; size sets the tier: one baseline cost per licence type, scaled by 0.8, 1.0 or 1.3 for operator size, replaces a complex set of fee bands.
Judge recovery over five years, not one: revenue exceeds cost in the early years as unlicensed operators enter the system, and falls below cost in later years as costs grow.
Benchmarks are a sanity check, not a price list: peers charge per vehicle, tonne, shipment or unit of capital, and revise their fees every three to five years.
The fee is not the whole bill: charges by other agencies and the cost of meeting licence conditions can equal the fee itself. Combined, fees and compliance costs remain below 4% of small operators’ operating surplus in every forecast year.
- What it means for each party
Regulators in any sector: a fee schedule is a financial model with legal consequences, so build it to survive an audit.
Finance ministries: assess cost recovery on the five-year balance rather than on a single year’s surplus, and confirm where fee income goes.
Operators: fees tied to effort and size are predictable, and a complete application costs less than an incomplete one.
Investors: a funded regulator is what turns a legal mandate into an enforceable market.
- The catch
- Cost recovery is a floor, not a policy goal. A regulator funded by fees must demonstrate that it operates efficiently and that those who pay do not set the price. Its fees must also remain affordable for the small and informal operators the law is trying to bring into the formal system.
1Why cost-recovery fees matter
A cost-recovery fee charges an operator what it costs the regulator to process, decide and supervise that operator’s licence, and no more. Public revenue law in many countries defines a fee as a compulsory payment for a public service of private benefit; that is what separates it from a tax. Licensing fits the definition: the regulator provides a service to an identifiable operator, and the fee is required to cover its cost. Standard setting, policy making and action against unlicensed operators serve the public at large and should therefore be funded from the public budget.
The pressure to get this right is growing. New waste laws make licensing compulsory for every operator, from a three-truck collector to a hazardous waste incinerator. Central revenue bodies increasingly require every fee to be justified through a standard dossier. In the jurisdiction behind this paper, a national fees framework set 20 requirements, ranging from a clear definition of the service and activity-based costing to a five-year financial model, international benchmarks and economic impact tests. In addition, digital licensing platforms make every fee, invoice and delay visible.
Getting it wrong has costs on both sides:
- Under-recovery: the regulator stays dependent on budget transfers. Inspection is usually the first budget line to be cut, which weakens the compliance that the licence was meant to secure.
- Over-recovery: the fee effectively becomes a tax without the legal basis that a tax requires, and small collectors and recyclers are pushed into operating without a licence.
- Unexplained fees: they invite challenge. When a reviewer cannot trace a fee to a cost, the whole schedule is reopened, often years after the work began.
The fee schedule is therefore not an administrative annex. It decides how much of the law the regulator can afford to enforce.
For investors the same schedule is a leading indicator. In several markets the law already requires producer responsibility schemes, source separation or licensed disposal, yet few of these requirements are applied in practice. The gap rarely lies in the law; it lies in an inspectorate that is not funded. As a result, licensed facilities compete on price with unlicensed ones. A fee schedule that funds licensing and inspection, and whose income is retained in the sector, is what turns a legal mandate into a functioning market.
This paper draws on a licensing and permit fee study that DAIS prepared for a national waste regulator in an emerging market. It covered 19 licence and permit types across collection and transport, sorting and recycling, storage, treatment, final disposal, landfill technologies, asbestos removal, and import, export and transit of waste. Figures are shown as percentages, ratios and counts. The method is not specific to waste or to one country. Any regulator that licenses identifiable operators, whether in water, energy, health, transport or the environment, can apply the same steps. Section 7 sets out what to adapt for different countries and sectors.
Four principles behind the fees
- Financial sustainability: recover the administrative and technical cost of issuing licences and permits, so the licensing system pays for itself.
- Fairness: differentiate fees by the type and size of operators and service providers and by their environmental impact, so that similar operators pay similar fees.
- Compliance: set licence fees at levels that give operators already in breach, and the informal sector, every reason to join the formal system.
- Investment: keep each fee fair and low enough that it never deters investment in the sector.
The executive regulation behind the study added two rules. A fee is a fixed amount, never a share of revenue or profit. It may reflect the nature and location of the activity, the size and capacity of the facility, the hazard and quantity of the waste, the technology used and the risks to health, safety and the environment. Temporary or local exemptions may be granted by ministerial decision, for example to attract investment in a service that the market does not yet provide.
2The method: activity-based costing in seven steps
Activity-based costing builds the fee from the bottom up: the steps a licence requires, the time and resources each step uses, and the number of licences expected.
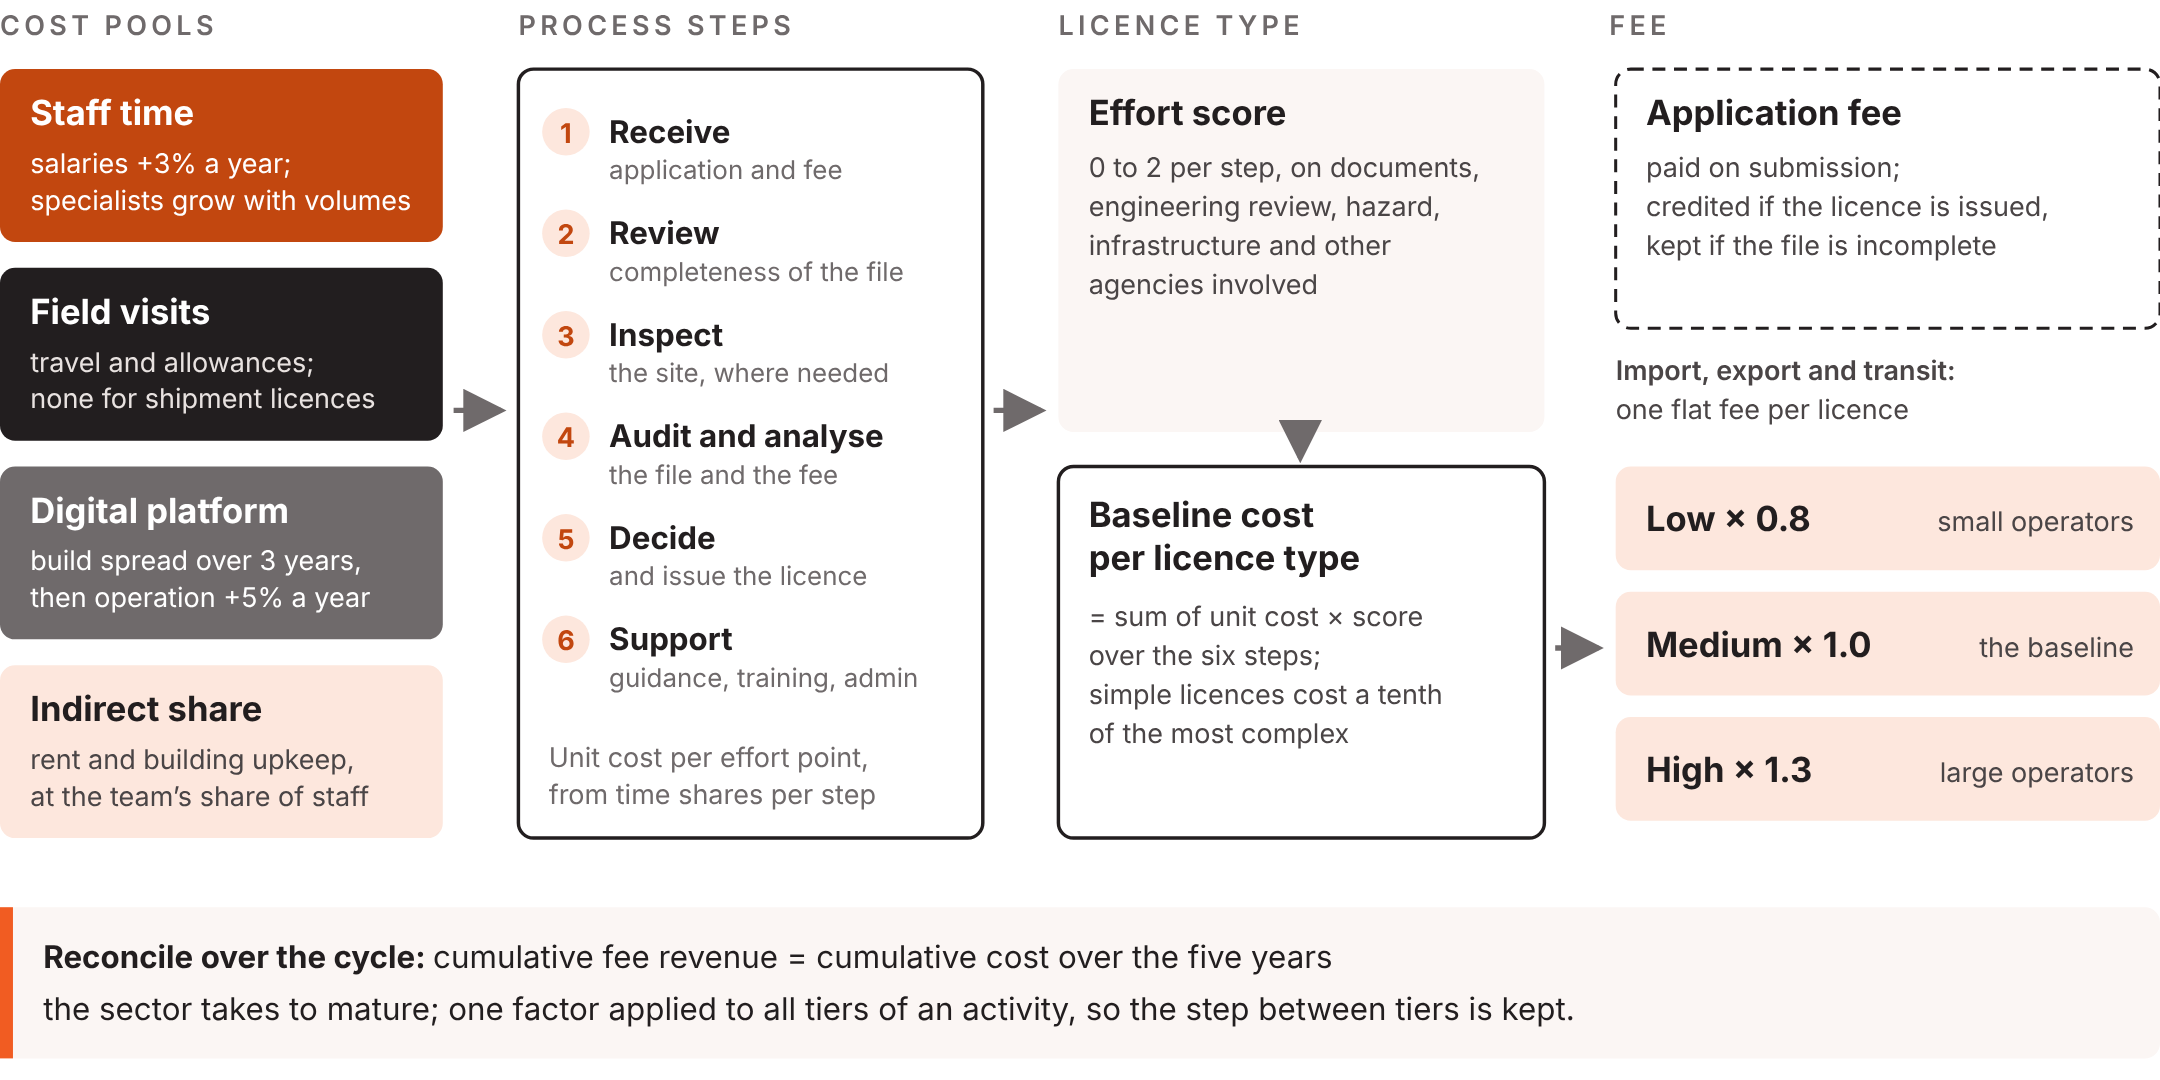
Cost pools are spread over six process steps, each step is weighted by the effort a licence type needs, and the baseline cost is scaled for operator size. Revenue and cost are then reconciled over the cycle.
- Map the process: the licensing cycle consists of six steps, namely receiving the application and fee; reviewing the file for completeness; inspecting the site where needed; auditing and analysing the file, including calculating the fee; deciding on and issuing the licence; and supporting applicants and staff through guidance, training and administration. Regulators elsewhere follow the same sequence. England’s Environment Agency, Ontario’s environment ministry and Ireland’s EPA all move from intake and a completeness check, through technical assessment, to a decision, and offer advice before an application is made. Where public consultation is required by law, it falls within the analysis and decision steps. Workshops with licensing staff and a time-and-motion review broke each step down into tasks and assigned each task a share of time. A site inspection, for example, is split into 10% planning, 70% site visit and 20% reporting. Administrative support is costed at 15% of specialist time.
- Cost the resources: four pools carry the cost. Staff are costed fully loaded, with salaries rising 3% a year and specialist numbers growing with applications. Field visit costs cover travel and allowances and are nil for shipment-based licences. The development cost of the digital platform is spread over three years, after which operation and maintenance costs rise by 5% a year. Indirect costs are a share of existing building rent and upkeep, allocated in proportion to the licensing team’s share of the organisation’s total staff. These are allocations of costs that already exist, not new spending.
- Score the effort: each licence type is scored 0, 0.5, 1 or 2 at each step on five to seven criteria: the number and variety of documents, the need for engineering review, environmental and health sensitivity, the complexity of the infrastructure and the number of other agencies involved. Multiplying the unit cost of each step by the score, and summing the results over the six steps, gives the baseline cost per licence type. The simplest licence (a waste transit permit) costs about a tenth of the most complex (hazardous waste treatment).
- Forecast volumes per licence type: a flat growth rate overstates later years. The study started from each licence type’s recent growth rate and allowed it to decay towards a saturation level, from about 30% in the first forecast year to zero by the fifth.
- Design the fee structure: multiply the baseline by a cost factor of 0.8, 1.0 or 1.3 for small, medium and large operators, with size measured by the variable that drives effort: vehicles, daily or annual capacity, technical complexity or capital invested. Use one flat fee where effort does not vary, as for import, export and transit. Charge an application fee on submission, which is credited against the licence fee if the licence is issued and retained if the file is incomplete. Priced at the cost of processing a file up to the point at which incomplete files are stopped, the application fee came to between about 15% and 30% of the baseline fee.
- Reconcile revenue with cost over the cycle: add up revenue and cost over the five years the sector takes to reach maturity, and apply one reconciliation factor in the same proportion to all tiers of an activity, so that the difference between tiers is preserved. Revenue exceeds cost in the early years, while the backlog of unlicensed operators enters the system, and falls below cost in later years as costs grow. Cost recovery should therefore be judged over the whole horizon, not in any single year.
- Test before approval: check the results against peers, the operator’s total burden and the profitability of small operators, and show how each fee would change if volumes fall 20% below forecast. Section 4 sets out the tests.
Six terms used in this paper
- Cost pool: a group of costs, such as staff or field visits, that the licensing work consumes.
- Effort score: a rating from 0 to 2 of how demanding a licence type is at each process step.
- Baseline cost: the cost of one licence of a given type, before any adjustment for operator size.
- Cost factor: the multiplier for operator size: 0.8 for small, 1.0 for medium and 1.3 for large.
- Application fee: paid when an application is filed; credited if the licence is issued, kept if it is not.
- Reconciliation factor: the single adjustment that brings cumulative revenue into line with cumulative cost over the cycle.
Cost factors and service times
The cost factor uses one variable per licence type. The thresholds were set with the regulator’s experts, based on estimates of facility sizes in the market, and are to be reviewed as market data improves. Each licence card also states a published service time, which gives operators a service commitment in return for the fee and gives the regulator an efficiency target.
| Licence type | Variable that sets the tier | Low | Medium | High | Service time (working days) |
|---|---|---|---|---|---|
| Collection and transport, non-hazardous | Vehicles | Under 10 | 10–50 | Over 50 | 3–5 |
| Collection and transport, hazardous | Vehicles | Under 5 | 5–30 | Over 30 | 7–10 |
| Sorting, storage and trading of recyclables | Capacity, tonnes a day | Under 10 | 10–50 | Over 50 | 3–5 |
| Temporary storage, hazardous | Capacity, tonnes | Under 10 | 10–100 | Over 100 | 7–10 |
| Treatment, hazardous and healthcare | Capacity, tonnes a day | Under 1 | 1–10 | Over 10 | 7–15 |
| Final disposal, hazardous; landfill lining and cell closure | Capacity, tonnes a year | Under 10,000 | 10,000–100,000 | Over 100,000 | 5–15 |
| Final disposal, municipal solid waste | Capacity, tonnes a year | Under 100,000 | 100,000–300,000 | Over 300,000 | 7–15 |
| Waste technologies | Technical complexity | Low | Medium | High | 5–7 |
| Recycling facility permit | Capital invested | Small | Medium | Large | 5–15 |
| Import and export | None: one flat fee | – | – | – | 2–3 |
| Transit | None: one flat fee | – | – | – | 1–2 |
3Benchmarks: a range check, not a price list
Benchmarks serve one purpose: to check whether a cost-based fee falls within a plausible range and, if it does not, whether the difference can be explained. They are a poor basis for setting a fee, because each comparator charges for something different. A benchmark shows whether a fee is plausible, never whether it is right.
The study screened peers against five criteria: the maturity of waste regulation and operations, economic proximity, transparent published fees, an independent waste regulator and the scale of planned infrastructure investment. Six were retained: Canada, Germany, Ireland, the United Arab Emirates, the United Kingdom and the United States.
| Comparator | What is charged | Basis and term | What it teaches |
|---|---|---|---|
| United States: Nevada, hazardous waste permits | Application deposit of up to $25,000 (storage) or $50,000 (treatment, landfill), drawn down at $50 per staff hour; annual fees from $2,500 to $50,000; $19 per ton disposed | Deposit, annual fee and per-tonne fee | Bill staff time directly where effort varies, and charge supervision every year |
| United States: New York City, trade waste | $600 application investigation fee, $5,000 licence fee and $500 per vehicle | Two-year licence | Split the fee into application, term and variable parts |
| United Kingdom: Environment Agency (England) | Permit application charge by activity; annual subsistence charge adjusted by compliance band; transfrontier shipments charged per notification, banded by number of shipments | Per application, yearly, per notification | Charge supervision yearly and let poor compliance cost more |
| United Kingdom: Health and Safety Executive, asbestos | Fixed assessment fee of £3,683 for a new licence or renewal; £844 for reassessment | First licence one year, renewals up to three | Price the regulatory event, not the calendar year |
| Germany: installation permits under the Federal Immission Control Act | Fee scaled to construction cost under each state’s cost ordinance; in North Rhine-Westphalia, €2,750 plus 0.3% of cost above €500,000 | Per permit; audits every one to three years | Capital-based fees follow project size, not effort, and weigh on large modern plants |
| Ireland: Environmental Protection Agency | Application fee by class and scale, from €10,000 to €35,000 for landfills; annual enforcement charge by risk category, adjusted for the past year’s compliance | Per application; enforcement charge yearly, ring-fenced | Fund supervision from a pooled, risk-based charge, and keep the income for enforcement |
| Canada: Ontario, environmental compliance approvals | Base fee of $100–200 plus a technical review fee by facility type and capacity: $1,500 or $6,000 for hazardous waste processing, below or above 100 tonnes a day; $6,000–60,000 for landfills | Per approval, set in regulation | Bands by type and capacity, published in law |
| United Arab Emirates: Dubai | Collection and transport permit of AED 1,000 per activity a year plus AED 300 per vehicle sticker; disposal charged per tonne, from AED 20 to AED 1,000 for hazardous waste | Yearly permit; per tonne | A disposal tariff is not a licence fee; compare like with like |
Sources: Nevada Division of Environmental Protection, RCRA permit fee summary; NYC Business Integrity Commission, trade waste fees; Environment Agency, environmental permitting charges guidance and waste shipment charges (2024); Health and Safety Executive, asbestos licence fees; North Rhine-Westphalia permit notice applying cost tariff 15a; EPA Ireland, Licensing and Enforcement Charging Policy; Ontario, Minister’s requirement on fees for environmental compliance approvals; Dubai Executive Council Resolution No. 58 of 2017.
Four rules for using benchmarks
- Normalise before comparing: convert every comparator to an annual equivalent per unit (per licence, per vehicle, per tonne), and state the exchange rate and its date. When comparing countries at very different income levels, also compare the fee with operators’ margins, since a market exchange rate alone does not show how heavily a fee weighs on a small firm in a poorer economy.
- Compare like with like: separate application, licence, variable and supervision charges. A one-off fee for a three-year licence is not comparable with an annual fee, and a disposal tariff is not a licence fee.
- Explain the outliers: in the study, cost-based fees for complex activities such as treatment and disposal were below those of most G20 peers, while fees for simple activities, such as non-hazardous collection, were close to or above them.
- Benchmark the total burden, not one fee: in the study, an operator dealt with up to seven other agencies, several of which charge their own permit fees, such as for commercial registration, an environmental permit and a civil defence certificate. A fee that looks modest on its own can still tip the total burden.
The benchmarking led to three conclusions: no single approach can be generalised, fee bases differ fundamentally between countries, and most peers revise their fees every three to five years.
4The tests a fee must pass before approval
A central revenue body asks two questions of a fee study: does the fee recover cost, and what does it do to the sector? The study addressed five tests. The tests that decide approval rarely concern the formula; they concern who pays, how much is paid in total, and the effect on the smallest operators.
- Cost recovery over the cycle: cumulative revenue against cumulative cost over the five years to maturity, with one reconciliation factor per activity to close the gap (section 2, step 6).
- The total burden: the regulator’s fee plus other agencies’ charges for the same operator (section 3, rule 4).
- Compliance costs: what operators spend to meet licence conditions, such as emergency plans, laboratory tests, weighbridges and staff training. These ranged from nothing for some import, export and trading licences to the cost of a technical study and specialist plans for treatment and recycling facilities.
- Profitability of small operators: fees and compliance costs together as a share of the operating surplus of small, medium and micro firms in waste collection, treatment and recovery (Exhibit 2).
- The wider economy: employment, foreign investment, inflation, household income and GDP.
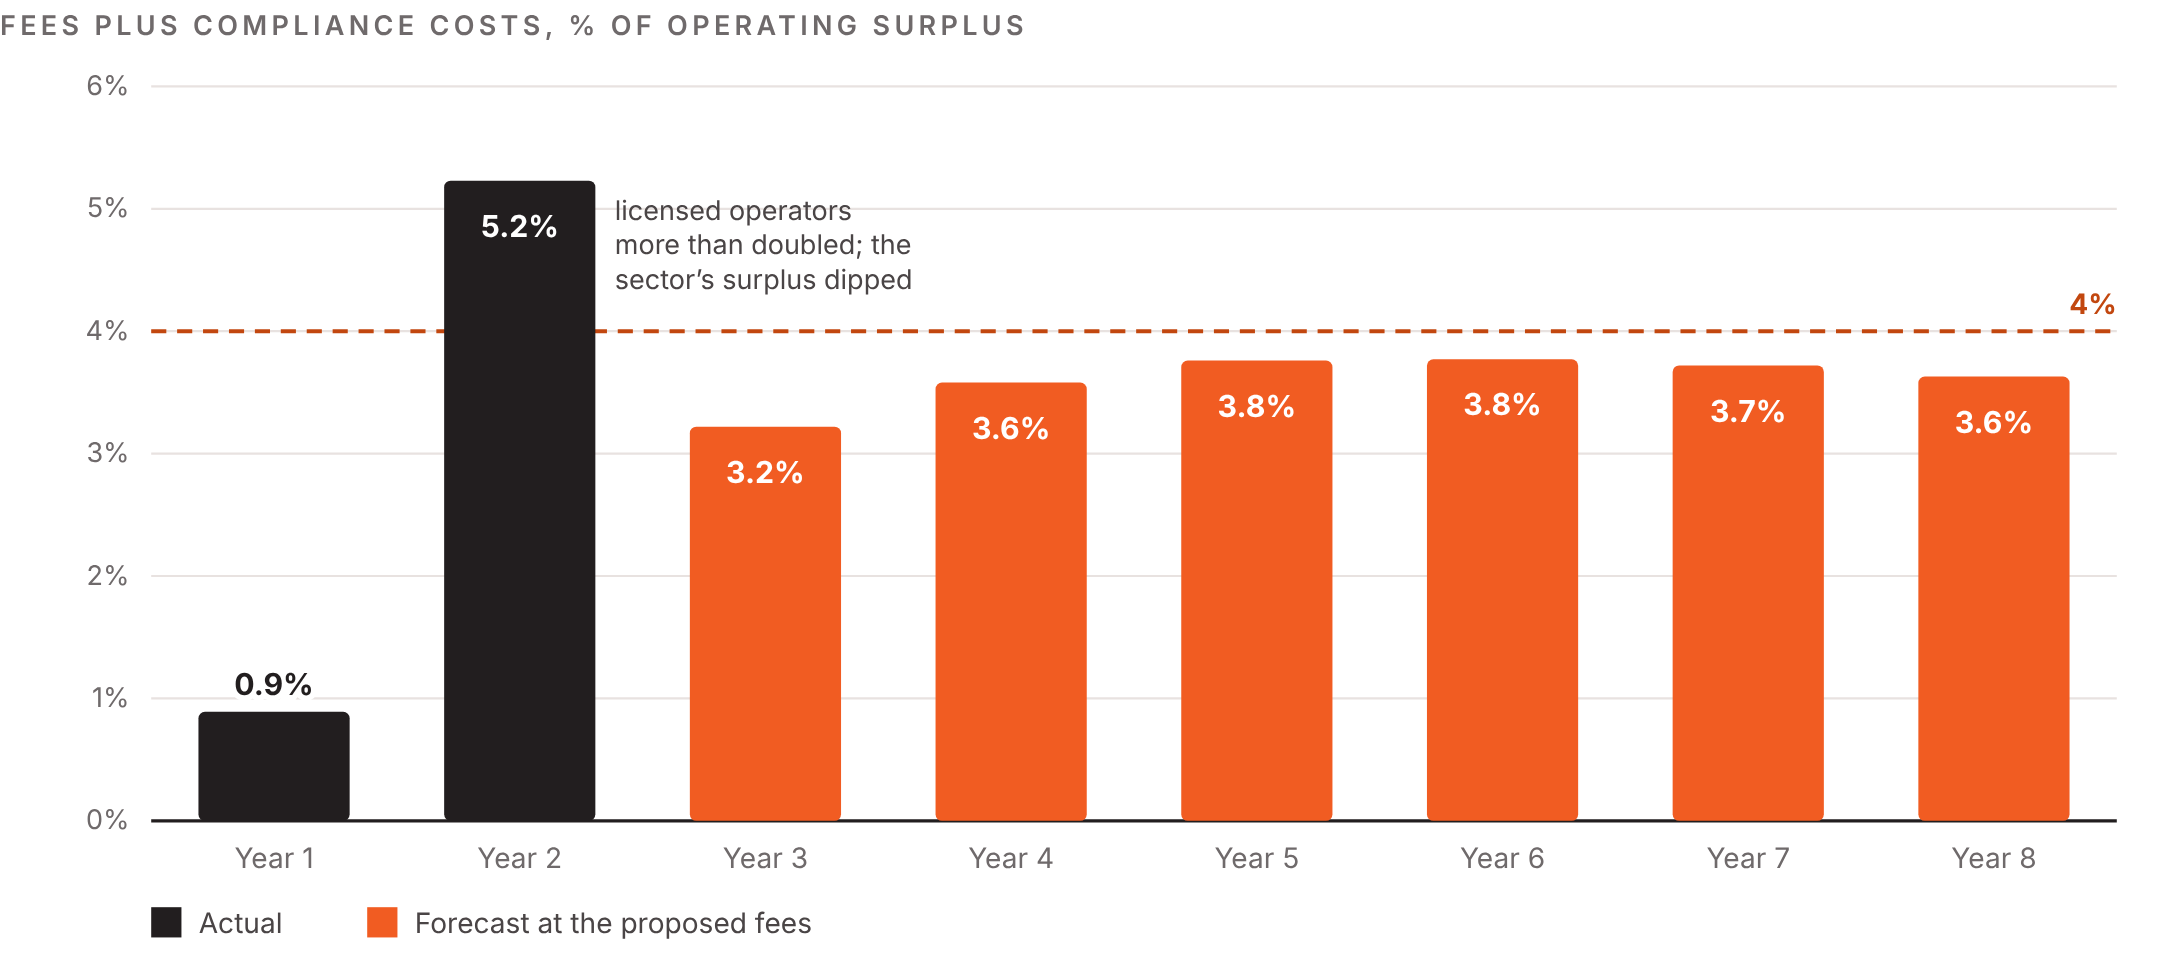
Under 1% in year 1; 5.2% in year 2, when the number of licensed operators more than doubled and the sector’s surplus dipped; between 3.2% and 3.8% in every forecast year (years 3 to 8) at the proposed fees.
Margins differ along the value chain: about 5–10% in collection and transport, 10–15% in sorting, and 30–40% in treatment and recycling and in trading sorted materials. The same fee therefore weighs most heavily on collectors. In the study’s market these were mostly larger firms able to absorb it; where collection is dominated by small or informal operators, the test becomes more important. Three safeguards protect the smallest operators: the low cost factor, a grace period for existing operators to regularise their status, and the option of a temporary exemption.
Based on the study’s input-output multipliers, fees and compliance costs would cost the sector a few dozen jobs a year, a small figure compared with the growth expected from foreign investment. The effect on inflation was below one thousandth of a percentage point, fee revenue was less than one part in 100,000 of GDP, and the effect on household income was negligible. Most OECD countries require a regulatory impact assessment of this kind for proposed new fees.
5Governance: who approves, who keeps the money, when to review
A regulator that sets its own fees invites two concerns: that it will overcharge, and that those who pay will come to influence its decisions. Both concerns are addressed through governance, not through the formula.
- Approval in two keys: the regulator proposes the fees and a separate body approves them. In the study’s jurisdiction, the regulator drafts the fees, its board approves them, and the finance ministry and a central revenue body review and approve them before they take effect.
- Keep the money in the sector: if the regulator cannot retain the income, cost recovery generates revenue for the treasury, not funding for the regulator. In the study, fee income goes to a dedicated fund that finances the sector. Where public finance law requires all fees to be paid into a single treasury account, a matching budget allocation agreed in advance can serve the same purpose. Ireland’s EPA uses ring-fencing: enforcement income pays only for enforcement, and any over- or under-spend is carried into the next year’s charges.
- Publish the costing: Australia requires a cost recovery statement to be published for every cost-recovered activity before charging begins. The statement is approved by the minister, updated with financial and performance data, and records the views of those who pay.
- Review on a timetable: the UK National Audit Office found in 2025 that changing a government fee took 63 weeks on average, and that only one of seven fee-funded services had cut its fees through efficiency savings in a decade. Re-baseline after the first full year of actual data, index fees yearly to staff costs, and review the whole schedule every three to five years, with an efficiency target each time.
Once licences are renewed every year, a natural next step is to link part of the renewal fee to the operator’s compliance record. Ireland’s EPA moves each site up or down a risk sub-category based on its enforcement history over the previous 12 months, and England’s Environment Agency adjusts annual charges by compliance band. Pricing the risk that an operator creates allows the operator to reduce its own fees through compliance.
6Ten mistakes that undermine a fee study
Most fee studies fail on definitions, volumes and late changes, not on the costing formula. Each mistake below either occurred in, or was avoided by design in, the fee studies and practices on which this paper draws.
A fee schedule can be correctly costed and still appear wrong for years if it is judged one year at a time.
| Mistake | What goes wrong | Existing practices | Recommended fix |
|---|---|---|---|
| 1. Pricing before costing | The schedule has no cost basis and cannot be defended | First schedules set to start licensing, before any costing | Cost first; use benchmarks only as a range check |
| 2. Costing the institution, not the activity | Costs unrelated to licensing load the fee | Department budgets divided by the number of licences | Cost pools, drivers and only the licensing share of shared assets |
| 3. One fee for all effort | Simple licences subsidise complex ones | A few flat fees across very different activities | Score effort per step for each licence type |
| 4. Size bands without a cost logic | Large and small operators pay the same, or bands jump | Bands by capacity with no link to the work involved | One baseline per licence type, scaled by 0.8, 1.0 or 1.3; thresholds reviewed with market data |
| 5. Two funnels | Unit costs and revenue rest on different volumes, so cost per licence is inflated | Cost models and revenue forecasts built on different approval rates | One set of volumes, drop-off rates and growth curves for cost and revenue |
| 6. Judging cost recovery year by year | Early surpluses look like overcharging; later deficits look like failure | Annual budget reviews of a sector still growing | Test cumulative revenue against cumulative cost over five years |
| 7. Removing real costs to lower a fee | The cost does not disappear; it moves elsewhere or goes unrecovered | Requests to drop support-staff time from the process | Keep every cost a step incurs; lower fees through process redesign |
| 8. Free incomplete applications | Staff time goes into files that never complete | Fees charged only when a licence is issued | An application fee on submission, credited if the licence is issued |
| 9. Ignoring the burden beyond the fee | A modest fee can still tip a small operator | Fees assessed alone | Test other agencies’ charges, compliance costs and small operators’ profitability |
| 10. Setting and forgetting | Fees drift away from cost as volumes and salaries change | No review date in the fee decision | Re-baseline after year one; review every three to five years; publish the costing |
7Adapting the method to other countries and sectors
The study priced waste licences in one country, but most of the method travels. What changes is the legal framework around the fee and the variables that describe effort and size; what remains the same is the costing logic and the tests.
What travels and what does not
| Travels as it is | Must be set locally |
|---|---|
| Activity-based costing with cost pools, process steps and time shares | The legal definition of a fee, and what it may and may not pay for |
| Effort scores per step and a baseline cost per licence type | The approval chain and who keeps the income |
| One cost factor per licence type for operator size | The variable behind each factor and its thresholds |
| An application fee credited against the licence fee | Service times, grace periods and exemptions |
| Reconciling revenue and cost over the growth cycle | The length of the cycle, from the sector’s own data |
| Testing burden, affordability and wider impact before approval | Benchmarks: which peers, at which income level |
Different starting points
| If your regulator… | Then |
|---|---|
| Is new, with little data | Start with an interim schedule and structured time estimates; cost from actual data after two or three years |
| Is mature, with years of records | Cost from recorded time and invoices, and set an efficiency target at each review |
| Sends all fees to the treasury | Agree a matching budget allocation in advance, or cost recovery will fund the treasury, not the regulator |
| Faces a large informal sector | Use a low tier, a simple registration route and a grace period, and test fees against small operators’ margins |
| Shares licensing with other agencies or levels of government | Map the operator’s whole journey, align definitions and units, and benchmark the total burden |
| Works in a lower-income economy | Judge affordability against operators’ surplus, not against richer peers’ fee levels |
The variable behind the cost factor, by sector
The cost factor needs one variable that rises with the regulator’s effort and is easy to verify. Examples outside waste:
- Water and wastewater: volume abstracted or discharged, or population served.
- Energy: installed capacity, or the voltage level of the network licensed.
- Health facilities: beds, or annual patient throughput.
- Transport operators: fleet size, or routes operated.
- Industrial environmental permits: emissions class or risk category, as Ireland’s EPA uses for its enforcement charges.
Whatever the sector, avoid variables that track the operator’s wealth rather than the regulator’s work, such as turnover or capital, unless effort genuinely rises with them.
8What to do: a checklist for regulators
Settle these twelve points before a fee schedule goes to approval. They are listed in the order in which a study is carried out.
Before costing
- Agree the costing method, the horizon and the treatment of platform and indirect costs with the approving authorities, in writing.
- Define each licence type as one activity, with one billing unit, one variable for the cost factor and one published service time.
- Agree where fee income is allocated and which site visits the fee covers.
While costing
- Map every step and role, record time shares, and keep every cost a step actually incurs.
- Score the effort of each licence type at each step, and write down the criteria.
- Forecast volumes with decaying growth towards saturation, and use the same volumes and drop-off rates for cost and revenue.
- Set the cost factors and thresholds, the flat fees and an application fee credited against the licence fee.
Before approval
- Reconcile cumulative revenue with cumulative cost over five years, and show how fees move if volumes fall 20% short.
- Normalise and verify every benchmark against the official schedule, and explain any outlier.
- Add up the operator’s total burden and compliance costs, and test them against small operators’ operating surplus.
- Run the economic tests: employment, investment, inflation, household income and GDP.
- Publish the costing, and set a review date with an efficiency target.
Method and sources
Source. This paper draws on a licensing and permit fee study for a national waste regulator in an emerging market, prepared by DAIS against a national fees framework. The client and country are not named. Figures are shown as percentages, ratios or counts, and no fee levels are disclosed. Benchmark examples come from public fee schedules reviewed during the study.
Limits. The lessons come from one regulator’s data, cross-checked against international comparators. Fee design also depends on each country’s fee law, revenue framework and policy goals. The method applies to any licensing regulator, but cost factors, thresholds and service times are specific to the study and should be set from local data.
This paper is for information only and is not legal, tax or financial advice.
Go deeper
Discuss a mandate
Talk to the team behind this paper about your own situation.
Go deeper
Cost-Recovery Fee Estimator
Indicative fee ranges by tier from your licence counts and process times.
Coming soon