
DAIS Insights · Paper 01
Measuring Clean Cities
How to design a quality assurance system that pays city cleaning contractors for clean public spaces rather than inputs, and how to calculate the City Cleaning Index behind it.
- B = 75Five grades from A (100) to E (0); grade B, the contract standard, scores 75 and earns full payment.
- 90% at BMinimum standard: grade B or better at 90% of sampled sites; every C, D or E grade is a timed work order.
- −25% to +5%Payment slides with the index: up to 25% deducted below 75, up to 5% bonus above 85.
In this paper
- 1Why city cleaning needs quality assurance
- 2The system: a closed loop in six steps
- 3The City Cleaning Index: how it is calculated
- 4From index to payment
- 5Correcting failures on the ground
- 6Sampling: random, zoned and weighted by population
- 7Benchmarks: what to borrow and what to adapt
- 8Ten mistakes that undermine city cleaning quality assurance
- 9Getting started: a shadow period and the tender cycle
- 10What to do: a checklist for city authorities
At a glance
- The signal
- Most cities pay cleaning contractors for workers, vehicles and service frequencies, then hire inspectors to watch them. A quality assurance system that grades places rather than people lets a city pay for cleanliness itself. One City Cleaning Index turns hundreds of site audits into a number a contract, a mayor and a resident can all read.
- Why it matters
- City cleaning is one of the largest municipal budget lines and is almost always contracted out. Residents judge their city by it. Yet when a contract specifies inputs, a contractor can be fully compliant while the streets stay dirty.
- What we found
Grade outcomes only. Eight elements residents can see, from containers to graffiti, each graded A to E against a reference visual standard.
Make the standard the pass mark. Grade B, the service standard, scores 75; meeting it everywhere earns full payment.
Weight what residents notice and where they live. Element weights come from a resident survey; zones are weighted by population, and hot spots are scored on their own.
Let the score set the payment, smoothly. A sliding scale on a three-month average replaces fixed bands; a bonus rewards sustained excellence.
Fix failures fast. Every C, D or E grade is a work order with a deadline; missed deadlines earn penalty points.
Separate doing from checking. Routine authority audits are validated by an independent body twice a year.
- What it means for each party
City authorities: write the outcomes, grading, payment rules, response times and caps into the contract before tender.
Contractors: a transparent score is fairer than discretionary fines, and it pays for results rather than headcount.
Regulators and funders: one index compares districts and cities over time and links spending to results.
Residents: the score is published, and their complaints decide where inspectors look.
- The catch
- An index is only as honest as its sample and its auditors. Without visual standards, enough sampled sites and independent validation, scores drift and payments turn on noise.
1Why city cleaning needs quality assurance
A quality assurance system tells a city how clean its public spaces actually are, why, and what the contractor should be paid for it. Most cleaning programmes have inspection; few have quality assurance.
This paper draws on a quality assurance system DAIS designed for a national city cleaning programme covering several regional city authorities and their municipalities. The system was designed for national roll-out and piloted in one major city. The pilot tested the tools and the authority's ability to run them. For this paper we have updated the design for cities in any country: the index grades outcomes only, uses five grades and pays on a sliding scale.
A review of contracts, organisation, operations, finance and supervision found four gaps:
- Contracts bought quantities, not quality: they specified numbers of workers and machines and how often each service ran. They said little about the result residents should see.
- Monitoring grew without quality growing: contracts relied on large numbers of unskilled workers (e.g. for litter picking and manual sweeping), so authorities needed large teams of inspectors to watch them. Costs rose; cleanliness did not rise with them.
- Information was thin: with weak IT tools, audit records were lost, past lessons could not be reused, and residents had few ways to report problems or rate the service.
- Roles overlapped: consultants hired to supervise contractors also advised the authority, and each authority used its own standards. Results could not be trusted or compared.
The design answered with a "best value" approach in five moves: design a target model from international good practice, engage residents to measure their satisfaction, build the tools (checklists, visual standards, key performance indicators or KPIs), automate the audit, and pilot before roll-out.
2The system: a closed loop in six steps
The system is a closed loop: each month's results change what is checked, where and how often next. Inspectors audit every week, the contractor is paid every month on a three-month average, and results are published every quarter. Six steps run in sequence, fed by residents and by the contractor.
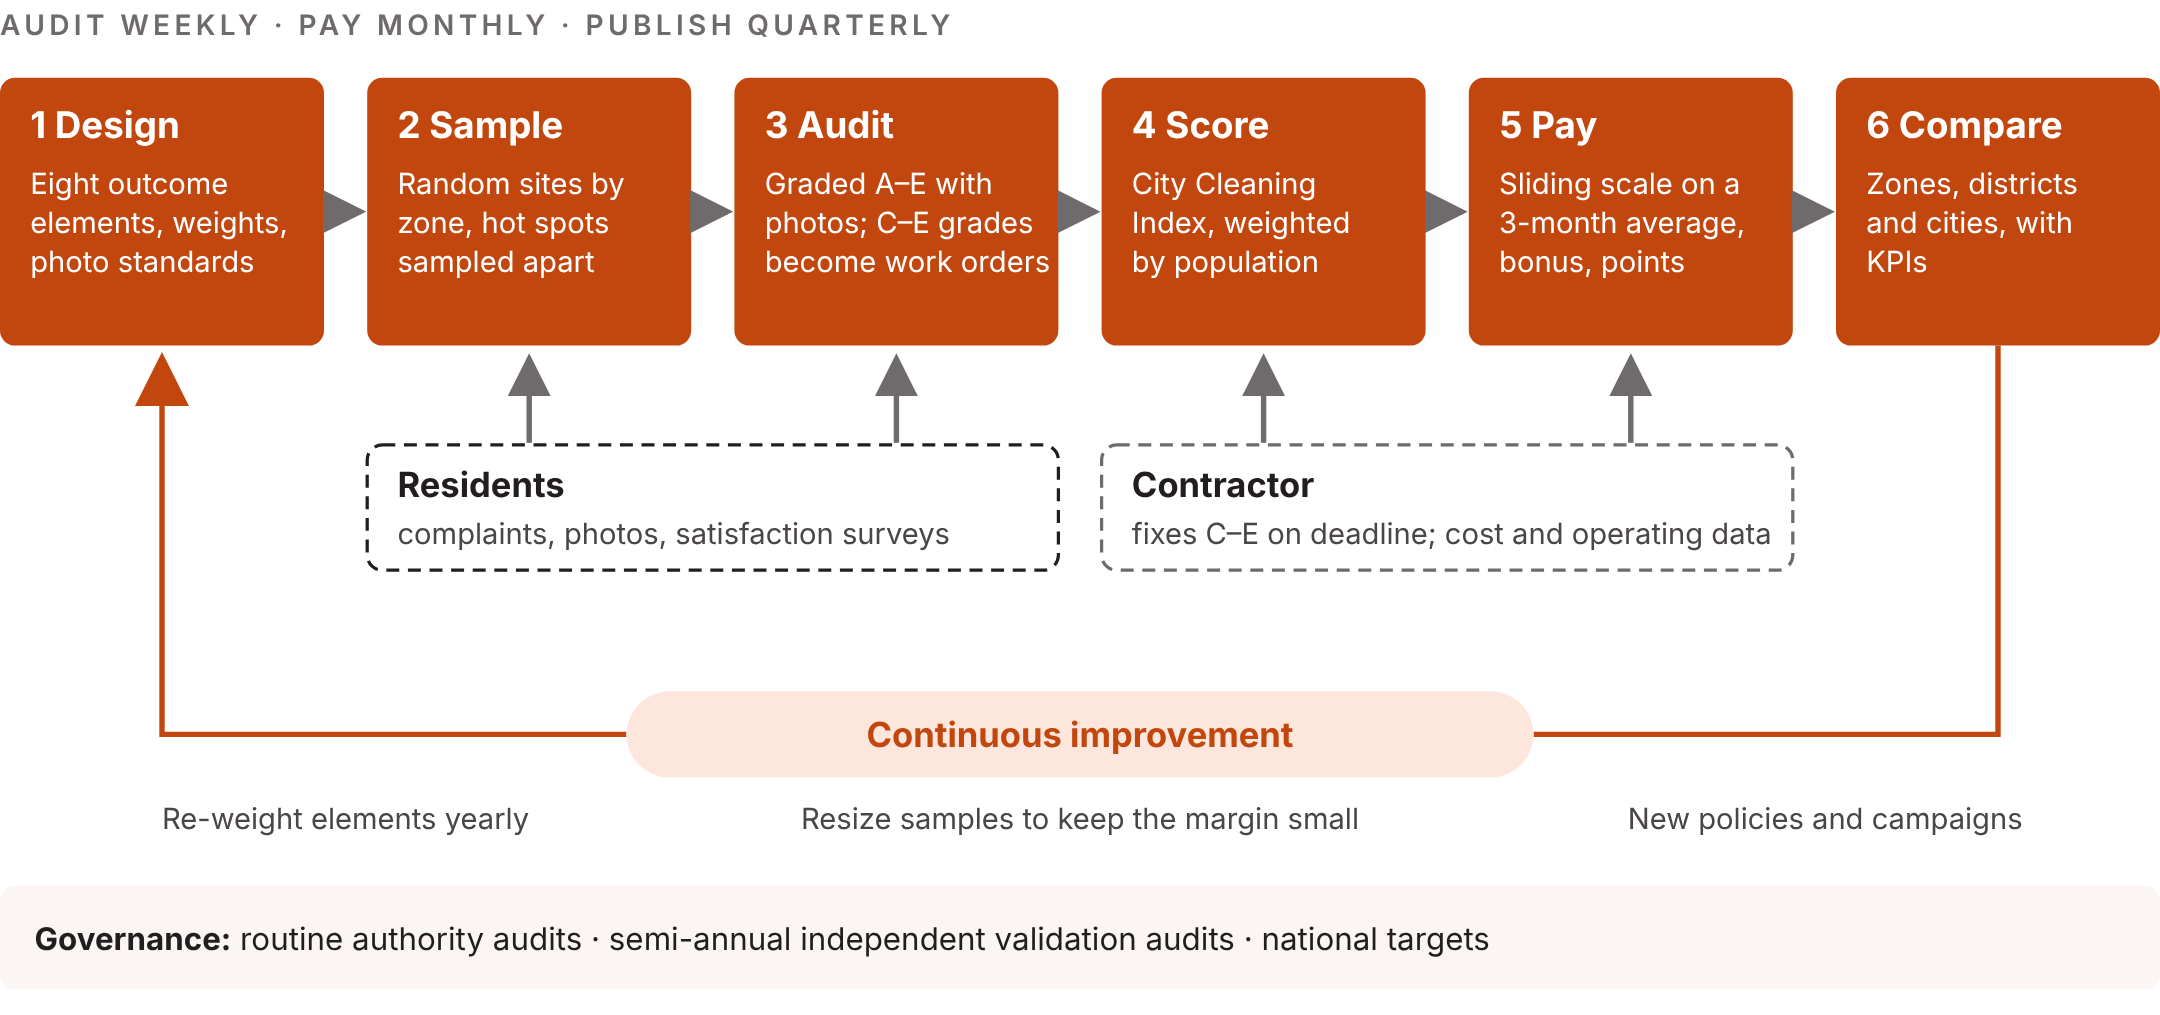
Results feed back into the next cycle: weights are reviewed yearly, samples are resized to keep the margin of error small, and visits increase where performance slips.
- Design: checklists cover eight elements residents can see, from containers to graffiti. Each element is graded on specific criteria, with a visual standard for every grade.
- Sample: sites are drawn at random within zones, and complaint hot spots are sampled as a group of their own. An app allocates each week's audit rounds to inspectors at random times, including evenings and weekends, taking each inspector's capacity into account.
- Audit: inspectors grade each criterion from A to E on an electronic checklist and attach photos as evidence. Every C, D or E grade becomes a work order with a deadline. Residents' complaints and periodic surveys feed the same database.
- Score: the database rolls the grades up into the City Cleaning Index, weighting zones by population, and calculates KPIs on cost, timeliness and satisfaction.
- Pay: the monthly payment slides with the three-month average index, with a bonus for sustained excellence and penalty points for missed deadlines.
- Compare: results are benchmarked across zones, districts and cities, and the lessons turn into new policies and public campaigns.
Who does what
| Party | Role in the loop |
|---|---|
| Residents | The main source of feedback: complaints through the municipal hotline, photo reports and periodic satisfaction surveys |
| Authority inspectors | Run routine authority audits at random sites and times on electronic checklists linked to the authority's control centre |
| Contractor | Fixes every C, D or E grade within its response time, sees audit results straight away, and supplies cost and operating data |
| City authority | Follows every indicator, directs the contractor and inspectors to weak zones and hot spots, and acts on survey results |
| Ministry / Regulator | Sets targets, receives performance reports and benchmarks authorities against each other |
| Independent third party | Trains authority teams and runs semi-annual validation audits, compared with the routine authority audits and published |
3The City Cleaning Index: how it is calculated
The City Cleaning Index measures how close a city's public spaces come to the best grade, from 0 to 100. It is built in three steps: criteria roll up into elements, elements into a score for each zone, and zones into the city index.
The grading scale
The index grades outcomes only: what a resident can see. Eight elements cover containers, pavements, streets, verges, public furniture, illegal dumping and graffiti. Every criterion is graded on five levels. Each level has a written definition and a reference photo in a visual standard, so two inspectors at the same site give the same grade. Grade B is the service standard written into the contract, and it scores 75.
| Grade | Points | Meaning | Example: liquid leaking from a waste bin |
|---|---|---|---|
| A | 100 | Exceeds the service standard | No leachate or trace of it around the bin |
| B | 75 | Meets the service standard | Traces of old, dry leachate only |
| C | 50 | Below the service standard | Recent leachate stains on the ground |
| D | 25 | Well below the service standard | Fresh leachate pooled around the bin |
| E | 0 | Unacceptable | Leachate running from the bin onto the street |
The minimum standard is grade B or better at 90% of sampled sites, reported each month as the compliance rate beside the index. Any C, D or E grade triggers corrective work within a set time (section 5).
Scoring B at 75 means a contractor who meets the standard everywhere earns full payment, and five grades keep an even 25-point step between them, so no single grade change causes a cliff.
The weights
Element weights reflect what residents notice most, measured in a baseline satisfaction survey. A survey matters because what residents notice is not what occurs most often. For instance, Keep Britain Tidy's 2012 survey found dog fouling at about 9% of surveyed sites, yet 64% of people named it the most offensive item; detritus failed at 39% of sites and ranked as a low public priority.
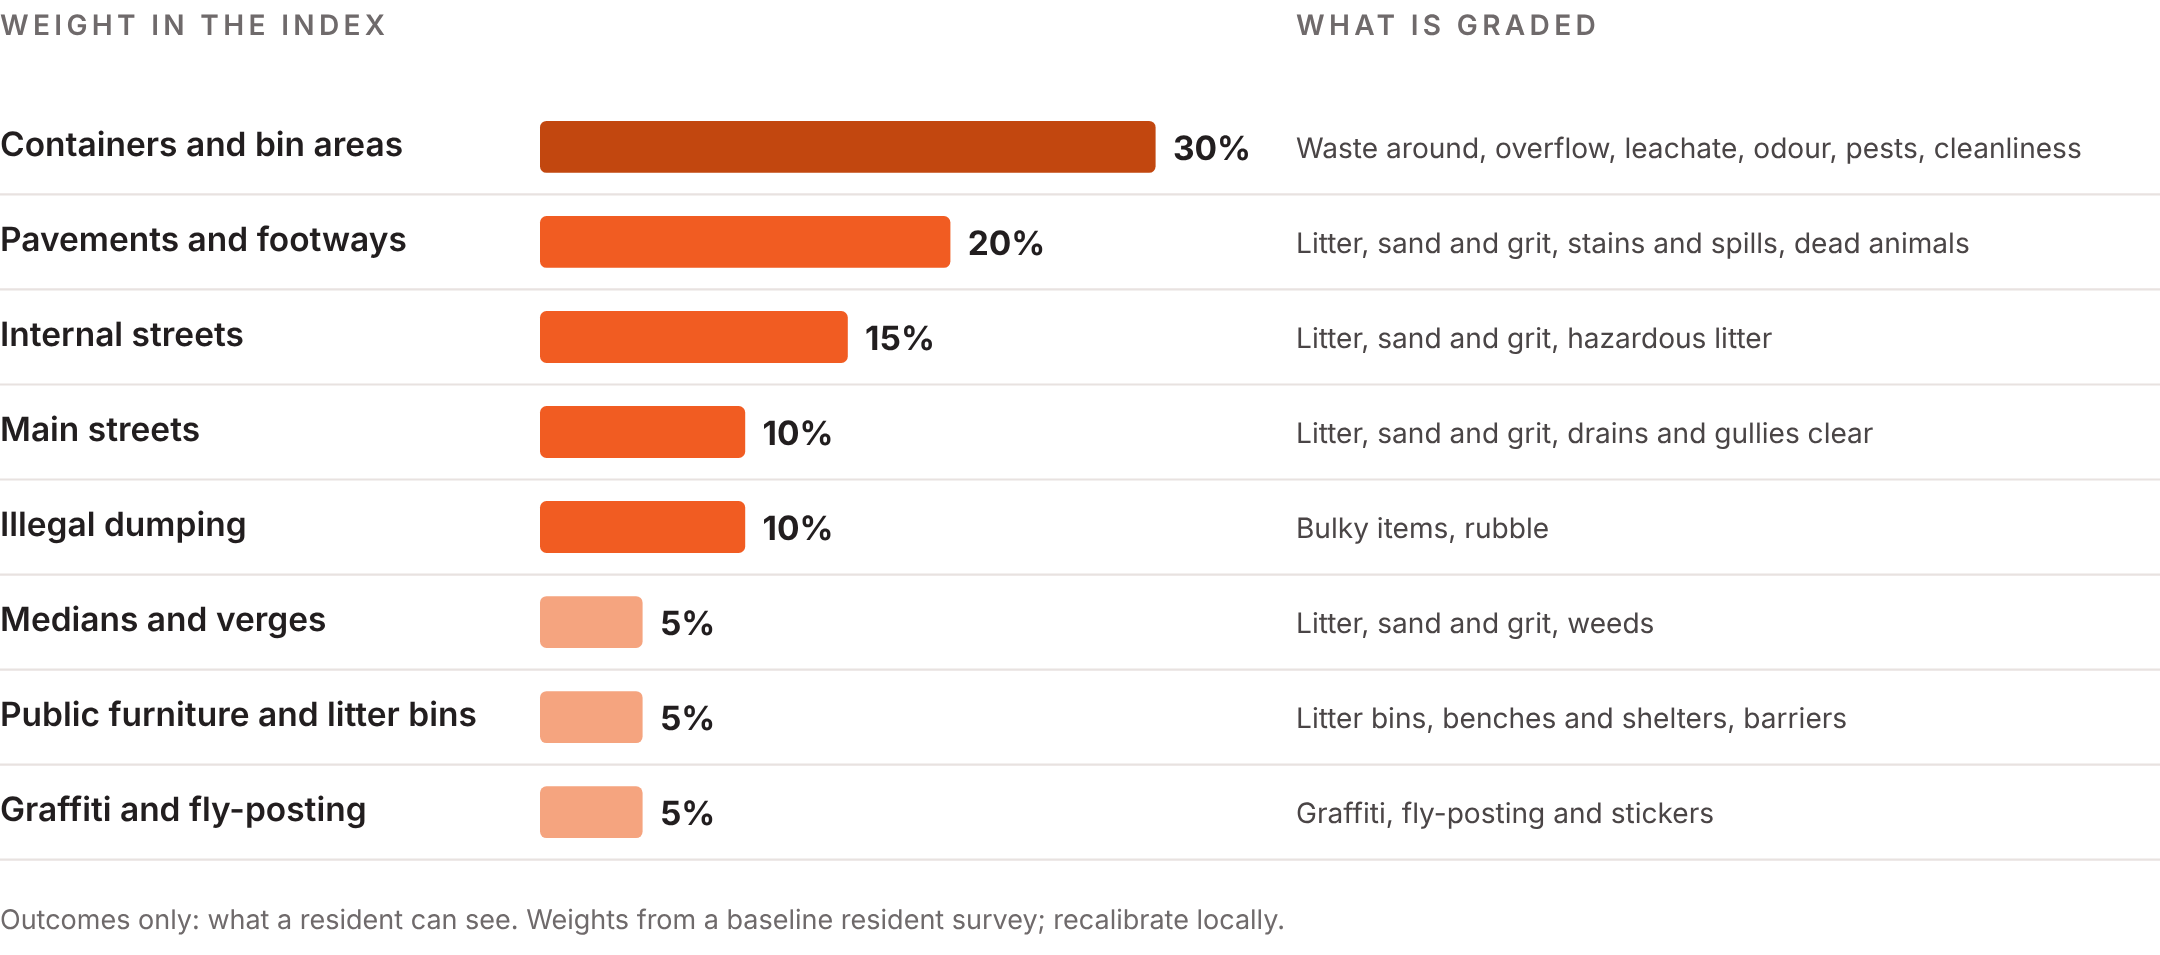
Eight outcome elements make up 100% of the index. Weights are illustrative and should be set from a local survey.
| Element | Criteria (weight within the element) |
|---|---|
| Containers and bin areas | Waste around the container 30%, overflow 25%, leachate 15%, odour 10%, pests 10%, container cleanliness 10% |
| Pavements and footways | Litter 40%, sand and grit 25%, stains and spills 20%, dead animals 15% |
| Internal streets | Litter 50%, sand and grit 30%, hazardous litter (glass, sharps) 20% |
| Main streets | Litter 40%, sand and grit 40%, drains and gullies clear 20% |
| Illegal dumping | Bulky items 50%, rubble 50% |
| Medians and verges | Litter 50%, sand and grit 30%, weeds 20% |
| Public furniture and litter bins | Litter bins (fill and cleanliness) 50%, benches and shelters 30%, barriers and tree guards 20% |
| Graffiti and fly-posting | Graffiti 50%, fly-posting and stickers 50% |
The calculation
The calculation in five steps
- Criterion score = grade points: A 100, B 75, C 50, D 25, E 0.
- Site score for an element = sum of (criterion weight × criterion score).
- Element score for a zone = average of that element's site scores in the zone. Hot spots form a group of their own.
- Zone index = sum of (element weight × element score for the zone).
- City Cleaning Index = sum of (zone population share × zone index).
If a criterion cannot be observed at a site, for example no drain on that stretch, it is left out and the other weights for that element are scaled up to 100%. If an element is absent from a whole zone, the other element weights for that zone are scaled up the same way.
A worked example
Take one container site. Its grades give a site score of 67.5, below the standard of 75: waste around the container and a dirty container pull it down.
| Container criterion | Weight | Grade | Points (weight × score) |
|---|---|---|---|
| Waste around the container | 30% | C | 15.00 |
| Overflow | 25% | B | 18.75 |
| Leachate | 15% | B | 11.25 |
| Odour | 10% | A | 10.00 |
| Pests | 10% | A | 10.00 |
| Container cleanliness | 10% | D | 2.50 |
| Site score for containers | 100% | 67.50 |
Averaging all sampled container sites in a zone gives that zone's container score, and the eight element scores give each zone's index. The city index then weights zones by population. In this illustrative month the city scores 73.0:
| Zone | Population share | Zone index | Contribution to the city index |
|---|---|---|---|
| Zone 1: Central area | 8% | 82.8 | 6.6 |
| Zone 2: High-density neighbourhoods | 42% | 74.1 | 31.1 |
| Zone 3: Low-density neighbourhoods | 22% | 79.6 | 17.5 |
| Zone 4: Informal settlements | 13% | 63.8 | 8.3 |
| Zone 5: Other areas | 5% | 75.7 | 3.8 |
| Hot spots | 10% | 56.6 | 5.7 |
| City Cleaning Index | 100% | 73.0 |
Zone scores are illustrative. Hot spots and informal settlements pull the index down most. Weighting by area instead would let large, lightly populated zones dominate.
By element, containers score lowest (67.6) and main streets highest (81.2); because containers carry 30% of the weight, they cost the city the most points. Zones 2 and 4 and the hot spots are below 75: if they stay there for two months running, each triggers a corrective plan even if the city index recovers (section 4).
4From index to payment
The index sets the monthly payment on a sliding scale. There are no fixed bands, so a fraction of a point never moves a whole band of money.
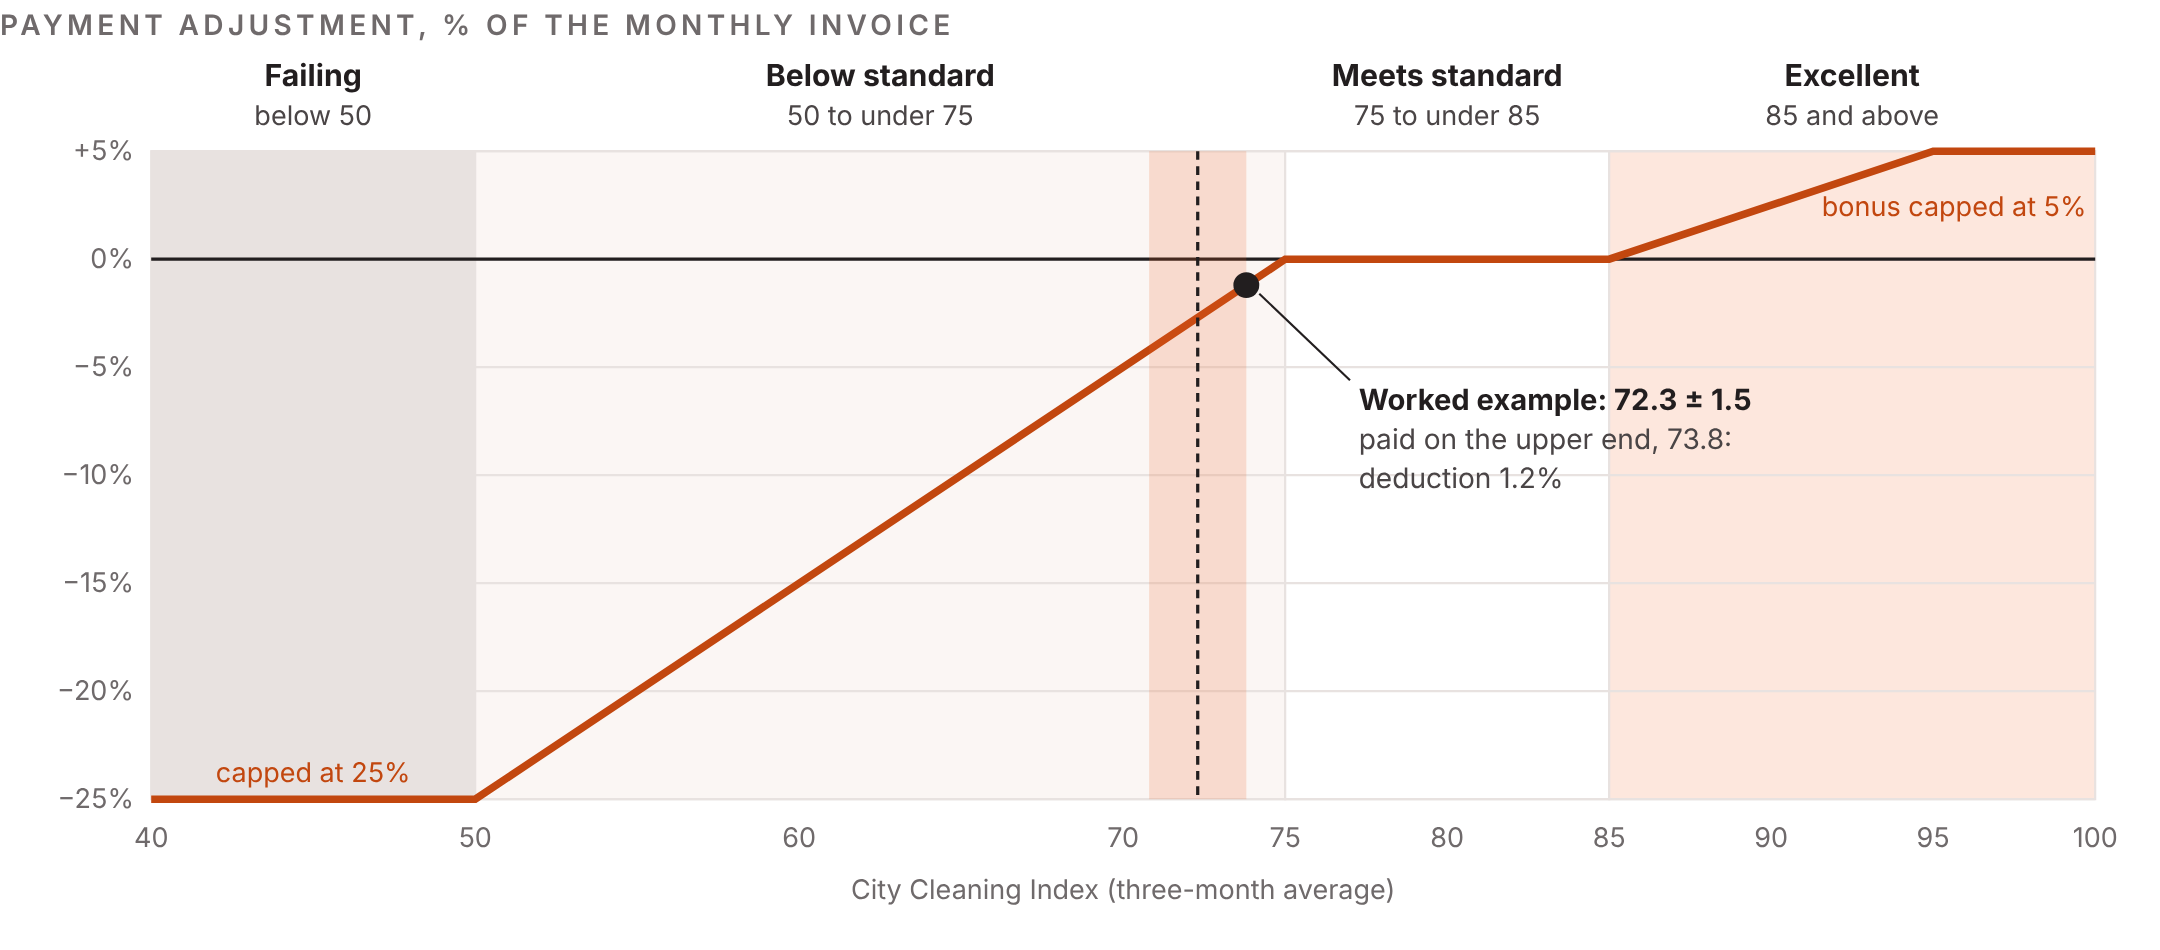
Full payment from 75 to 85; 1% deducted for each point below 75, up to 25%; a bonus of 0.5% for each point above 85, up to 5%. Parameters are illustrative.
| Index (three-month average) | Rating | Payment |
|---|---|---|
| 85 and above | Excellent | Bonus of 0.5% per point above 85, up to 5%, if no zone is below 75 and at least 90% of sites reach grade B |
| 75 to under 85 | Meets standard | Full payment |
| 50 to under 75 | Below standard | 1% deducted per point below 75 |
| Below 50 | Failing | 25% deducted; formal warning and corrective plan |
Monthly payment, three months of evidence
Contractors submit monthly invoices, but one month's sample is too small to pay on, and a full quarter is too slow to correct. We recommend auditing continuously and paying on a rolling average:
- Audit every week, at random sites and times, including evenings and weekends.
- Pay each month on the average of the last three monthly indices, which carries a full quarter's sample.
- Charge missed correction deadlines in the month they occur.
- Publish the index, compliance rate and satisfaction by zone every quarter, and recalibrate weights and visual standards every year.
Giving the benefit of the doubt
Every index is published with its margin of error. Deductions are calculated on the upper end of that margin and bonuses on the lower end, so sampling noise never costs the contractor money or pays a bonus the streets have not earned.
The payment in the worked example
Three-month average index: (71.6 + 72.3 + 73.0) ÷ 3 = 72.3, with a margin of error of ±1.5.
Index deduction: paid on the upper end, 73.8, so 1% × (75 − 73.8) = 1.2%.
Penalty points: 10 missed deadlines at 2 points and 4 repeats at 3 points make 32 points; at 0.1% for each point above a monthly allowance of 20, that is 1.2%.
Total: 2.4% of the monthly invoice, well inside the 30% cap. On an invoice of 1,000,000 in any currency, the deduction is 24,000.
Caps and persistent failure
Deductions must be large enough to change behaviour and small enough to stay proportionate. Neither the UK nor Australia sets a statutory cap; contracts set their own, and caps set too low can leave most of the fee payable even when service stops. We recommend three limits, calibrated to the contract's margin:
- An index deduction of up to 25% of the monthly invoice, reached at an index of 50.
- Penalty points worth up to 10%.
- A combined cap of 30%. Beyond it, deductions stop growing and the contract moves to remedies: a formal warning when the index is below 50 or the cap is reached, and a right to step in or terminate if that happens in three of any six months.
Deductions should be written as a proportionate adjustment for service not delivered, not as a penalty.
Floors that stop the index hiding failure
One city number can let clean districts mask a failing one. Three rules prevent it:
- Report scores by zone and element to the authority every month and publish them every quarter.
- Any zone or element below 75 for two months running triggers a corrective plan, whatever the city index says.
- Pay the bonus only when no zone is below 75 and at least 90% of sites reach grade B.
Beyond the index: six KPIs
The index says how clean the city is. Six KPIs say how fast failures are fixed, whether residents agree, and what the result costs:
- Cost per resident served
- Cost per index point
- Share of C, D and E grades fixed on time
- Complaints per 10,000 residents
- Share of complaints closed on time
- Resident satisfaction score
Without a cost KPI, a contractor can lift the index by adding labour, and the authority cannot tell good value from expensive. Without a satisfaction KPI, nobody checks that measured clean is felt clean.
5Correcting failures on the ground
A grade is also a work order. When a site falls to C, D or E, the authority intervenes and the contractor must restore it within a set time, shorter where more people pass and where the failure is worse:
| Zone | Grade E: fix within | Grade D: fix within | Grade C: fix within |
|---|---|---|---|
| Zone 1: Central area | 1 hour | 4 hours | 12 hours |
| Zones 2 and 4, hot spots | 6 hours | 24 hours | 48 hours |
| Zones 3 and 5 | 24 hours | 48 hours | 72 hours |
| Any zone: sharps, hazardous waste, offensive graffiti | 2 hours | 2 hours | 2 hours |
Response times are illustrative.
The inspector's app opens the work order and the contractor closes it with a photo as evidence. A missed deadline earns penalty points: 2 for a first miss, 3 for a repeat at the same site. Points convert to a deduction on a sliding scale, for example 0.1% of the monthly invoice for each point above a monthly allowance of 20, up to the 10% cap. Points are recorded automatically, which removes the manual follow-up that made old daily fines slow and loosely applied. The grade itself affects only the index, so the same failure is never charged twice.
6Sampling: random, zoned and weighted by population
The sample has to be large enough to be fair, random enough that the contractor cannot clean only the audit route, and weighted to where people live and complain.
| Group | What it covers | Sample over three months (share of area) | Weight in the index (example) |
|---|---|---|---|
| Zone 1 | Central area | 20% | 8% |
| Zone 2 | High-density neighbourhoods | 10% | 42% |
| Zone 3 | Low-density neighbourhoods | 5% | 22% |
| Zone 4 | Informal settlements | 10% | 13% |
| Zone 5 | Other areas not covered by zones 1–4 | 5% | 5% |
| Hot spots | Top 25% of areas for complaints per resident and failed audits, in any zone | 20% | 10% |
- Random within zones: Sites and times are drawn afresh each week, so no street can be cleaned "for the inspector".
- Hot spots are a group of their own: Their sites are sampled and scored separately, so the extra visits do not drag down the zone around them, and the hot-spot score is published on its own.
- Hot spots move: When an area falls out of the top quartile, it returns to its zone's normal sample.
- Samples follow performance: Where results stay stable and good, samples can shrink; where they slip, they grow.
Why population, and its traps
Weighting by population makes the index reflect what residents experience; weighting by area would let large, lightly populated zones dominate. Population weights have their own traps, and each has a fix:
- Central areas have few residents but many visitors: Weight the central zone by daytime population or footfall, not by residents.
- Population data goes stale: Update weights yearly from census or utility data, and review zone boundaries as the city grows.
- Small zones give volatile scores: Set a minimum number of sites per zone, whatever its weight.
- Contractors may favour heavily weighted zones: The zone floor in section 4 stops a low-weight zone being neglected.
Fairness, seasons and events
Complaint data is not neutral. Residents of poorer districts report problems less often even where conditions are worse. Hot spots are therefore defined from complaints per resident and failed audits together, and informal settlements keep a minimum sample whatever their complaint count. The contract should also say which seasons, festivals and weather events, such as sandstorms, adjust the response times or suspend the score.
7Benchmarks: what to borrow and what to adapt
The grading idea is not new. England's Code of Practice on Litter and Refuse (Defra, fourth edition, 2026) grades areas from A to D and sets response times by intensity of use. England's national survey reports both an average grade and the share of sites below grade B, across litter, detritus, weeds, staining, graffiti and fly-posting. New York's Scorecard counts only its two cleanest ratings as acceptably clean. In each case the acceptable grade is the pass mark. The system described here borrows that logic and extends it from a duty standard to a payment mechanism.
| Feature | England's Code of Practice | This system | Lesson |
|---|---|---|---|
| Grades | A (no litter) to D; land below B must be restored to A within the response time | A to E, scored 100 to 0, across eight outcome elements | A fifth grade separates "below standard" from "failing" |
| Zones | Four, by intensity of use; response times from half a day to 28 days | Five zones plus hot spots; response times from 1 to 72 hours; weighted by population | Use zones for sampling, weighting and response times |
| Evidence | Visual grading against written descriptions | Visual grading against a visual standard, with photos attached to each audit | Photos settle disputes before they reach a payment |
| Purpose | A standard the duty body must maintain | A measure the contractor is paid against | Payment needs independent validation behind it |
Sources: Defra, Code of Practice on Litter and Refuse, fourth edition (March 2026), England; Local Environmental Quality Survey of England methodology; Office of the New York State Comptroller, Street and Sidewalk Cleanliness audit (2020).
Three rules for adapting a benchmark
- Borrow the scale, calibrate the standard: Take the graded logic, but create your local visual standards. In arid cities, sand and grit need their own criterion.
- Borrow the zones, set your own samples: Response times suit a duty standard; sample sizes and weights suit a payment mechanism. A contract needs both.
- Do not import thresholds: The 90% compliance target, the payment slope and the caps should be set from a local baseline, measured during the shadow period (section 9).
From samples to census
Brussels now scores streets with cameras on refuse trucks: in June 2026 its cleanliness agency expanded a trial to 16 trucks and 700 km of roads, feeding a 0–5 Clean City Index. Los Angeles set out in 2016 to rate every street each quarter from dash-cam video. Automation widens coverage and improves accuracy, but it does not replace the visual standard: reference photos for each grade are what cameras are trained and audited against, and photo evidence still settles disputes.
8Ten mistakes that undermine city cleaning quality assurance
Most failures come from what the contract measures and who measures it, not from the formula. Each mistake below appeared in, or was designed out of, the city cleaning contracts and practices this paper draws on.
A contractor can meet every quantity in the contract while the street outside stays dirty.
| Mistake | What goes wrong | Existing practices | Recommended fix |
|---|---|---|---|
| 1. Buying inputs, not outcomes | Compliance is measured in headcount and trucks, not in clean streets | Contracts specified numbers of workers and machines and service frequencies | Define graded outcomes, the index and the payment rules in the contract |
| 2. Inspecting people instead of places | Monitoring cost rises without quality rising | Large unskilled workforces required large inspection teams | Audit sampled places; leave labour and fleet to KPIs, not the index |
| 3. Pass/fail checklists | No gradient between nearly clean and filthy; every borderline case is argued | Pass/fail judgements depended on the individual inspector | Replace pass/fail with graded points. Use five grades scored from 100 to 0 |
| 4. Grades without photos | Inspectors disagree, and contractors dispute results | Written descriptions with no visual standards | Provide comprehensive local visual standards with a photo for every grade of every criterion |
| 5. Equal weights | A dirty bench counts as much as an overflowing container | An unweighted average misses residents' priorities | Weight by public impact and review weights yearly |
| 6. Predictable inspections | The contractor cleans the audit route, not the city | Inspection routes were predictable and defined in the operational plan | Random sites and times each week, allocated by app |
| 7. Ignoring residents | Complaints are handled one by one and never shape the audit | Residents' satisfaction was neither measured nor used | Feed complaints into hot spots, and surveys into weights and KPIs |
| 8. Fines nobody applies | Manual fines are slow to calculate and applied loosely | Daily fines were applied loosely because each needed manual follow-up | Record penalty points automatically when a deadline is missed |
| 9. Cliff edges in payment bands | A fraction of a point moves a whole band of payment | Fixed bands meant a quarter of a point could halve a deduction | A sliding scale on a three-month average, paid within the margin of error |
| 10. Letting the same body do and check | Results cannot be trusted or compared | Supervising consultants also advised authorities, a conflict of interest; each authority used its own standards | Separate roles; add independent semi-annual validation |
9Getting started: a shadow period and the tender cycle
Start in shadow: Run the full system for six months with no money attached: audits, index, work orders and reports. Use the period to test whether two inspectors give the same grade, refine the visual standards, size the samples and measure the baseline from which the 90% target, the payment slope and the caps are set. Share the shadow results with the contractor, so the first paid month holds no surprises.
Time it to the tender: City cleaning contracts often run three to seven years. When the national system in this paper was ready, most regional authorities had already tendered their contracts, so only a minority could adopt it at the next round. Authorities mid-contract can agree a variation, start with the bonus side only, or run the index in shadow until renewal.
10What to do: a checklist for city authorities
Settle these twelve points before and during a cleaning contract. They are ordered as a programme runs.
Before tender
- Define the outcome elements, and write the grading, index, payment rules, response times and caps into the contract.
- Set element weights from a baseline resident survey.
- Map the zones with their population (daytime population for the centre), and use a year of complaint data to locate hot spots.
While designing
- Write criteria for each element, with a visual standard for every grade from A to E.
- Pilot the checklist in one district, and test whether two inspectors give the same grades at the same site.
- Set monthly sample sizes per zone and for hot spots, so the margin of error stays within about two points.
- Run a six-month shadow period with no money attached, and set thresholds from its baseline.
In operation
- Audit weekly at random sites and times, and turn every C, D or E grade into a timed work order.
- Pay monthly on the three-month average, applying deductions, bonus, points and caps automatically.
- Publish the index, compliance rate and satisfaction by zone every quarter.
- Validate routine authority audits with independent audits twice a year and publish the comparison.
- Review weights, samples, visual standards and response times every year.
Method and sources
Source. This paper draws on a quality assurance system for municipal city cleaning that DAIS designed for a national programme covering several regional city authorities, including checklists, visual standards, sampling rules, penalty schemes and KPI definitions. The client and country are not named. Worked examples use illustrative figures, not client data.
Limits. Weights, sample sizes, response times, payment parameters and caps are illustrative and should be set from a local baseline. Benchmark details come from public sources and were checked in October 2026.
This paper is for information only and is not legal or financial advice.
Go deeper
Discuss a mandate
Talk to the team behind this paper about your own situation.
Go deeper
City Cleaning Index calculator
Estimate your index and payment from audit grades.
Coming soon